Syslog Monitoring
In this lesson, we’re going to take a look at syslog monitoring on Cisco IOS devices. We’ll also take a look at the use cases and how we can configuration and verify it on our devices.
Exam Topic
4.0 Network Assurance
4.2 Configure and verify device monitoring using syslog for remote logging
Video Overview
Overview
You’ve probably seen syslog messages before when administering Cisco devices.
To give you an idea of what the messages look like, you can see an example below.
%LINK-3-UPDOWN: Interface Tunnel1, changed state to up
Syslog is a logging mechanism that’s built into all Cisco devices; routers, switches, firewalls, access points – you name it. The syslog messages themselves contain rich and in-depth detail regarding events that have occurred on our device.
The syslog messages themselves can provide a huge benefit to IT administrators by allowing them to take advantage of syslog for monitoring and identify problems that have occurred in the past.
Messages can be output to a number of locations:
As you can imagine, some events that take place on our device can be considerably more important than others. For instance, an interface going down on our device is considerably more severe than configuration that has been applied to our device.
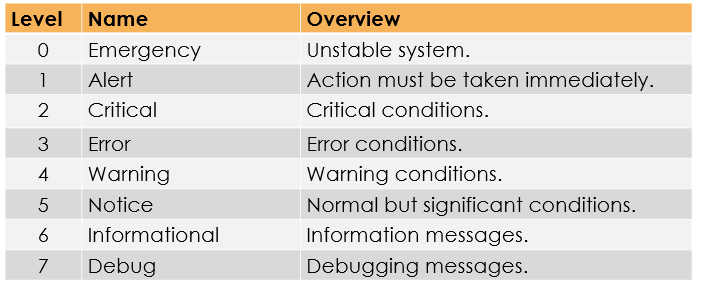
The great thing about syslog is that our messages are split into 8 categories’, depending on the severity of the message.

In addition to this, our syslog messages are formatted in order to provide us with a wealth of information.
Lets take a look at an example and break it down.
*Mar 1 00:03:27.451: %DUAL –5–NBRCHANGE : IP-EIGRP(0) 10: Neighbor 192.168.13.3 (Tunnel1) is up: new adjacency
Mar 1 00:03:27.451 – Indicates the
timestamp of when the syslog event happened.
%DUAL – Indicates the
facility tag. Each source on our Cisco IOS device that generates syslog messages has its own tag.
%DUAL is used as the event represents an EIGRP event.
5 – Indicates the
severity of our syslog message. If we correlate this to our table above, the event is classed as a notice.
NBRCHANGE
– Indicates the mnemonic. This is used to uniquely identify the syslog message. In this example, it’s telling us there has been a change to our EIGRP neighbour relationship.
IP-EIGRP(0) 10: Neighbor 192.168.13.3 (Tunnel1) is up: new adjacency
– Indicates the description of the syslog event. In the example it’s telling us we’ve formed an EIGRP neighbour relationship with 192.168.13.3.
Console Output
By default, syslog messages generated by our device are displayed onto the console.
R1#
%LINK-3-UPDOWN: Interface Tunnel1, changed state to up
The messages are displayed in real-time whilst we’re physically connected to our device, via console cable.
If we’re not physically connected to our device and instead connected via SSH or Telnet, we won’t see the syslog messages on the console by default.
In order to view the syslog messages whilst connected remotely, we can run the following command:
R1#terminal monitor
NOTE: This command needs to be entered every time we open a new remote session with our Cisco device if we want to see the syslog output on the console.
Logging Buffer
We have the ability to store syslog messages within the physical memory of our Cisco device – known as Logging Buffer.
By default, the size of memory allocated for syslog message storage is 4096 bytes. Because of this, it’s recommended to increase the size of the buffer. The reason for this is that once our buffer is full, syslog messages are overwritten.
We have the ability to change the amount of memory allocated to buffering messages.
R1#configure terminal
R1(config)#logging buffered 8192
NOTE: It’s key not to allocate too much memory to our syslog buffer, otherwise we’ll have limited memory left to perform other essential tasks on the device.
We can view the messages stored within the logging buffer with the following command:
R1#show logging
As syslog messages saved within the buffer are stored within memory, they’re lost upon the device reloading.
Remote Syslog
The final method of outputting syslog messages generated by a Cisco device is to send them to an external server to store.
You can just imagine the benefits this provides based on the methods we’ve looked at so far. Just think of the amount of devices within the network generating syslog messages.
Can you imagine how much of a nightmare it would be having to connect to each device manually to check the syslog messages?

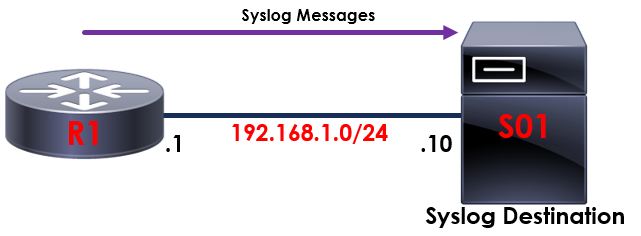
The topology outlined above provides an example of how remote syslog operates.
Our syslog messages generated by R1 are exported and sent to S01.
Syslog messages are sent to S01 using UDP/514.
We can configure this on R1 as follows:
R1#configure terminal
R1(config)#logging 192.168.1.10